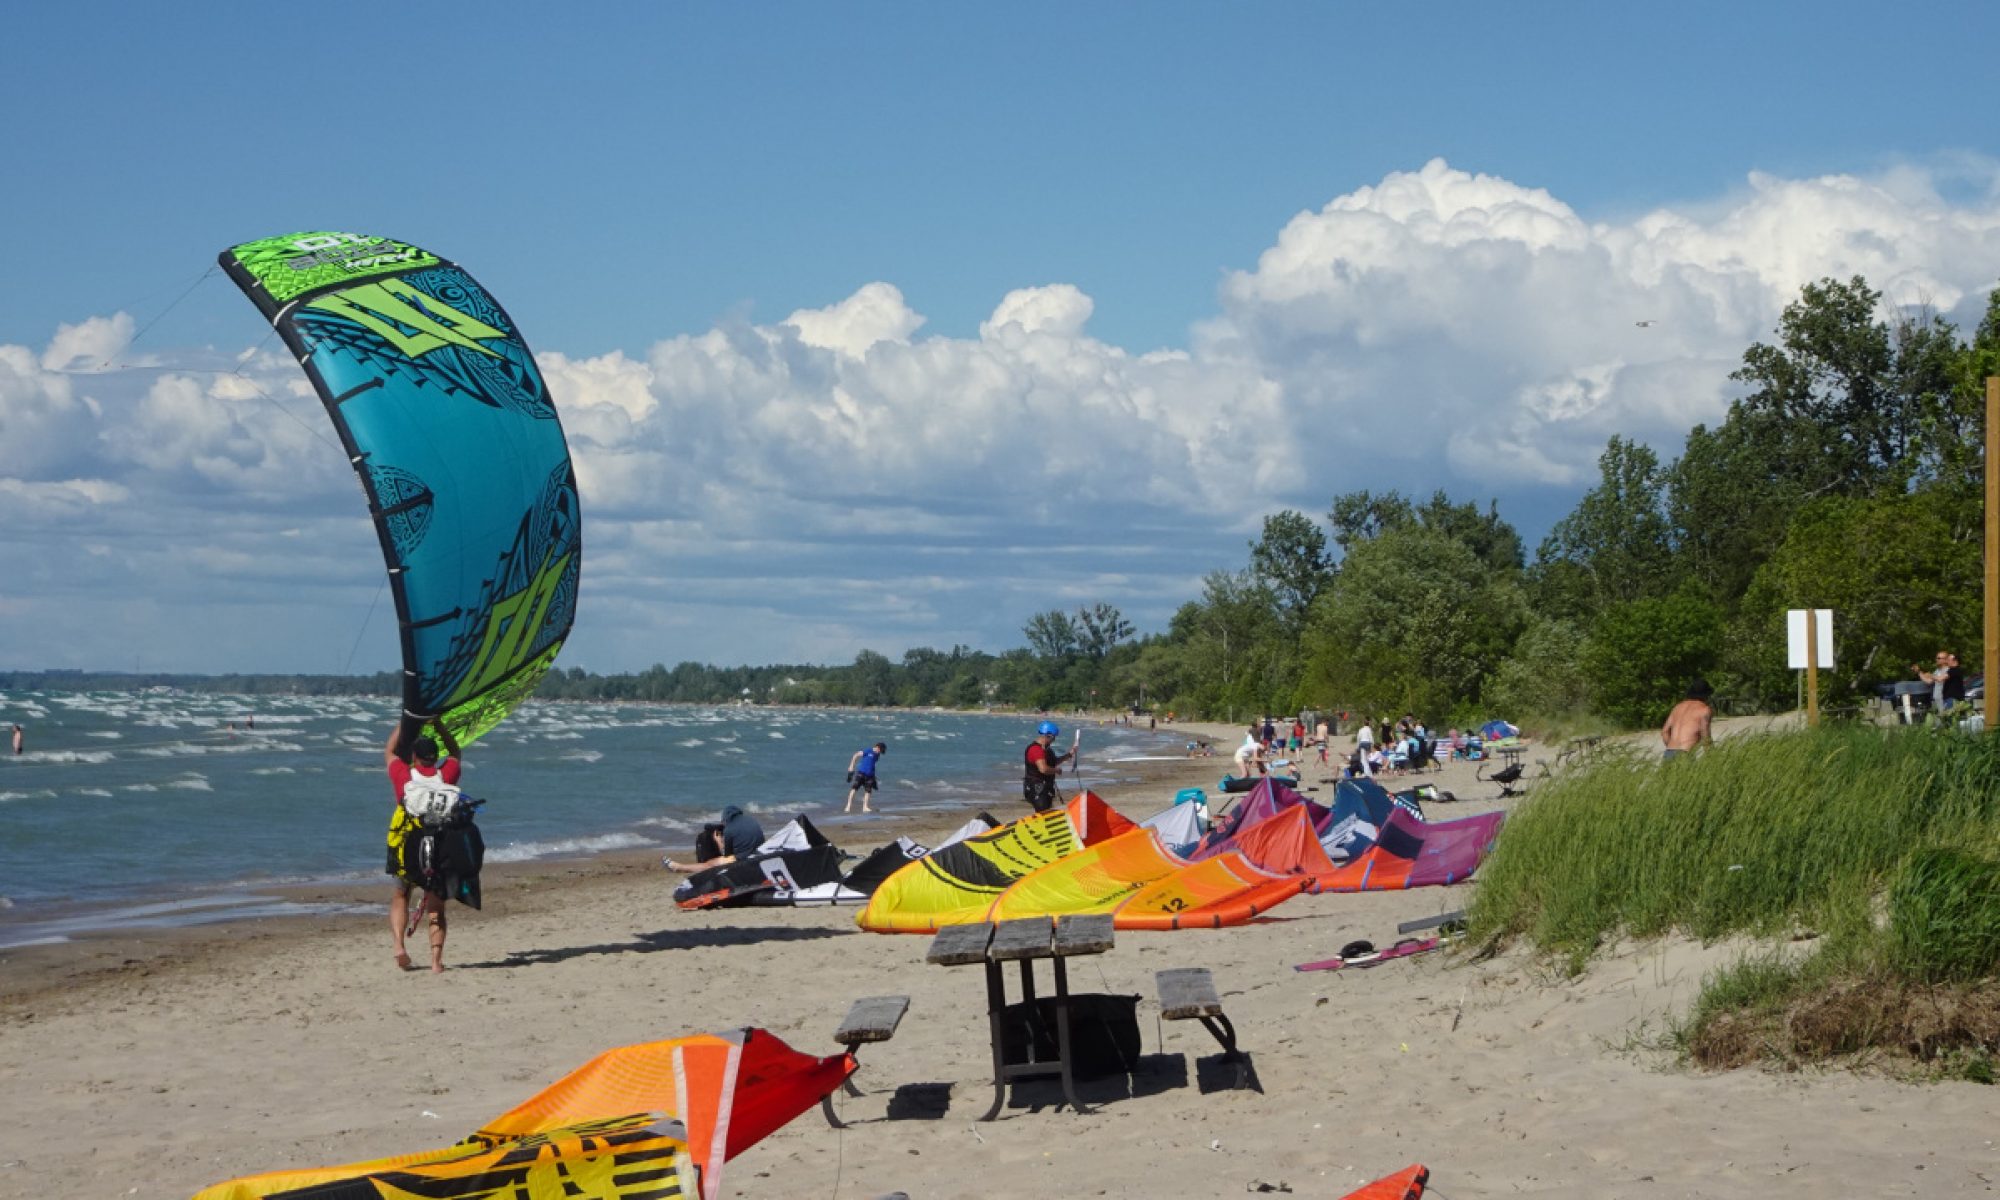
Most of my posts involve pictures taken from the vantage point of the beach. I’m amazed how the ice changes daily, and I caution people about walking out on the ice. The more I see the daily changes in ice conditions, the more cautious I am myself during my daily walks.
To see what’s really going on, NASA provides a service called “EOSDIS Worldview”.
We went through a warming trend last week and I found the changes in the ice striking.
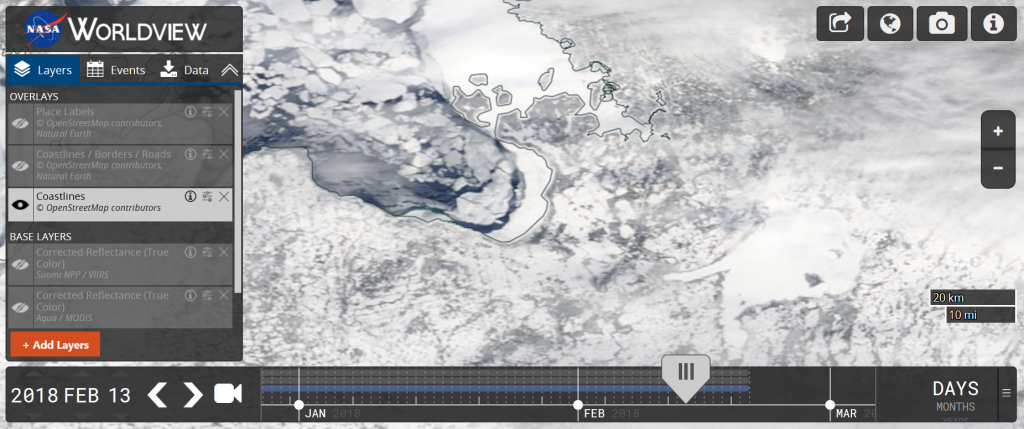
Below is the satellite view on February 13th. You can see that the bay is frozen. As a reminder of the weather, my daily posts for the week of February 11th here – they show that on Tuesday (Feb 13), the low was -12 C and we reached a high of -2 C.
Note the ice coverage on Georgian Bay. The Nottawasaga Bay is frozen to a distance from shore of ~ 5 miles. The east and north parts of the bay toward Parry Sound and Manitoulin Island are frozen solid.
Just one day later, with warmer weather you see a massive change in the ice. We got all the way up to 8 C on Wednesday (February 14th) and this made a massive difference. Open water all around as you see from the satellite photography below.
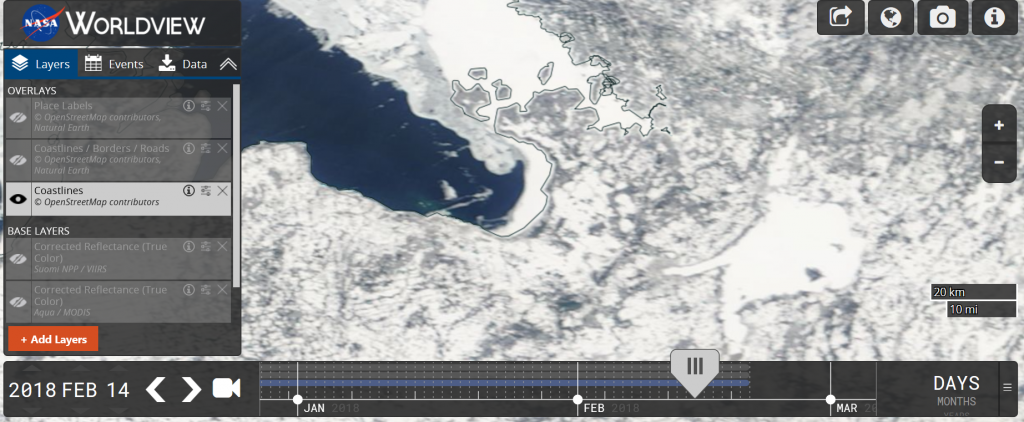
I hope this makes my point for those that take the time to study the data. The changes in a 24 hour period can be massive. Tens of miles of ice disappear overnight.
I don’t want to further embarrass the anonymous family I “dissed” for being out on the ice Sunday, Feb 18th, but as I post this Monday (Family Day in Ontario), the safe ice they thought they were walking on, is now open water days later.