| Sun | Mon | Tue | Wed | Thu | Fri | Sat | |
|---|---|---|---|---|---|---|---|
| Sep20 | Sep21 | Sep22 | Sep23 | Sep24 | Sep25 | Sep26 | |
| High | 20.1 | 22.5 | 25.3 | 22.8 | 26.6 | 28.2 | 26.9 |
| Low | 6.8 | 4.3 | 6.3 | 10.5 | 7.9 | 13.1 | 13.2 |
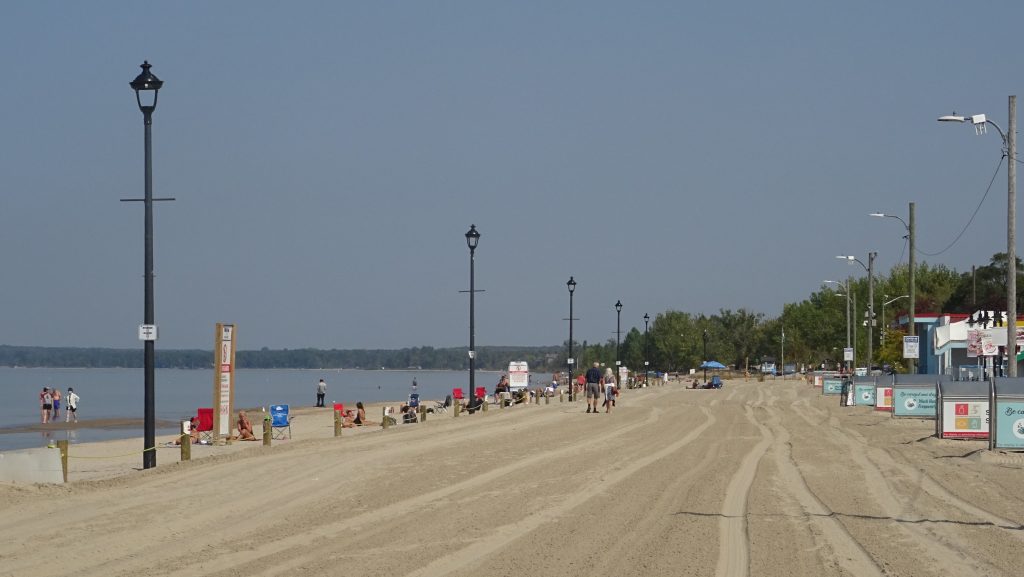
September rolls on and COVID numbers are sadly ticking up across the province. A pop-up car rally towards the end of this week didn’t make our mayor or town council very happy. Like all beach residents, I’m grateful to the town and the OPP for surging resources to Wasaga Beach to help keep things under control. I have no problem with people have fun and enjoying custom cars, but nobody has patience for idiots racing up and down residential streets.
News of the pop-up rally was widely reported in Ontario with local news coverage here – https://www.barrietoday.com/coronavirus-covid-19-local-news/pop-up-car-rally-unacceptable-says-wasaga-mayor-2737890. It’s only getting started as I write this on a Saturday, so I suspect there will be more news soon.
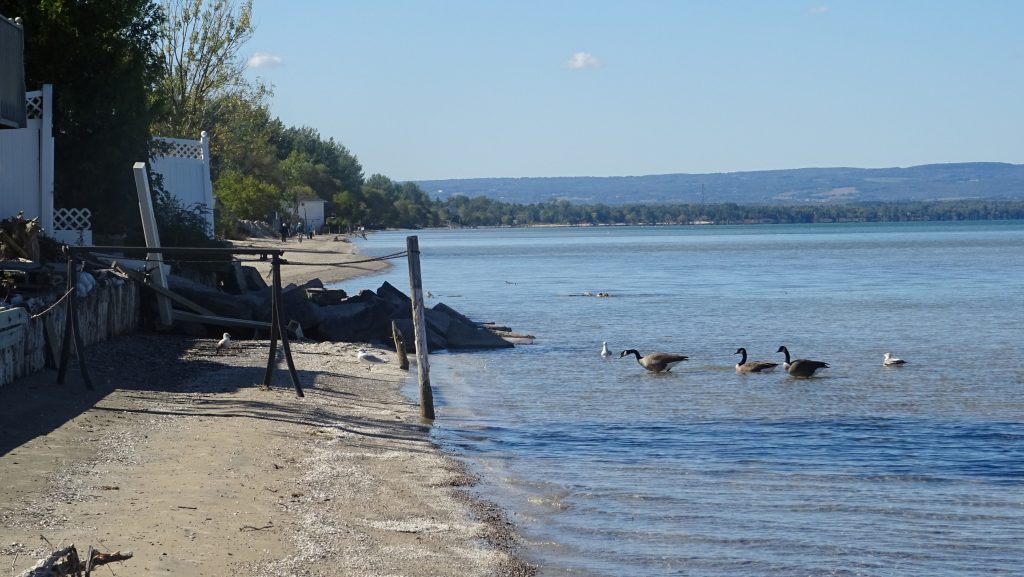
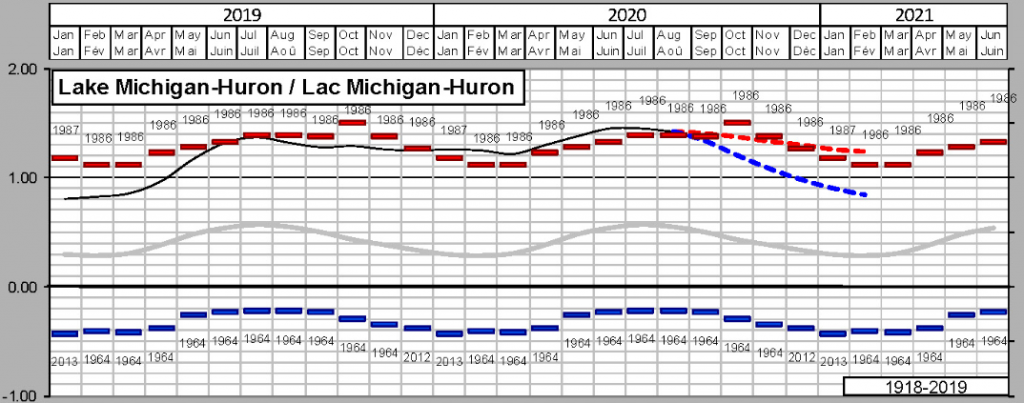
Before I continue, just an interesting digression about great lakes water levels. The chart below comes from Fisheries and Oceans Canada.
https://www.waterlevels.gc.ca/C&A/bulletin-eng.html
The great lakes are all at different elevations. Lake Huron and Lake Michigan flow into one another such that they equalize at the same water level. Lake Superior is typically ~700 feet above sea level. Superior feeds Lake Michigan/Huron through a series of rapids and Lake Michigan/Huron is ~25 feet lower than Lake Superior. Water levels drop a further ~3 feet flowing through the Detroit River into Lake Erie. At Niagara Falls where Lake Erie drains into Lake Ontario, there is a further sudden ~326 foot drop and water continues to flow out at ever lower elevations through rapids along the St Lawrence River system to the Atlantic Ocean at sea level.
The chart above shows ~100 years or recorded history of Great Lakes water levels. The red bars are all-time high water marks, and the blue bars are all time lows. The Great Lakes were breaking records for all time lows as recently as 2012 to 2013. What the data shows is that through all of 2020, the Great Lakes have been at 100 year record highs. For example, in July 2020, water levels were above the previous record high last recorded in 1986. The dotted red lines project September 2020 and beyond are estimated highs, and the blue lines are estimated lows. You can see that present water levels are roughly 1.4 meters (4.6 feet) above historical long-term averages recorded over ~100 years. Needless to say, this is an enormous amount of water. The good news is that while water levels are projected to remain high, they appear to be dropping slightly below record levels. (see chart above)
Average water levels change seasonally (the gray fluctuating line that looks like a sine-wave). What makes things even more complicated is that the Earth’s Crust is not staying still. To account for this, a standard called the IGLD 85 (International Great Lakes Datum 1985) was published. This represents the sold horizontal black line. All water-level measurement are presently relative to IGLD 85. While this sounds crazy, IGLD 85 is an update from IGLD 55. (The datum needs to be re-calibrated every 25-35 years. this is because the earths crust is still slowly rebounding from the retreat of Glaciers that used to cover the great lakes region. A detailed explanation of IGLD 85 is here – https://www.in.gov/dnr/water/files/11WhatIsIGLD1985.pdf. What makes this complicated is that the speed with which the crust is re-bounding is not uniform so the relative changes between the great lakes are not uniform. To put this in perspective, elevations at harbor beach in Lake Huron increased by slightly less than 1cm between 1955 and 1985. It’s been 35 years, so we’re due for a new IGLD standard reference.
